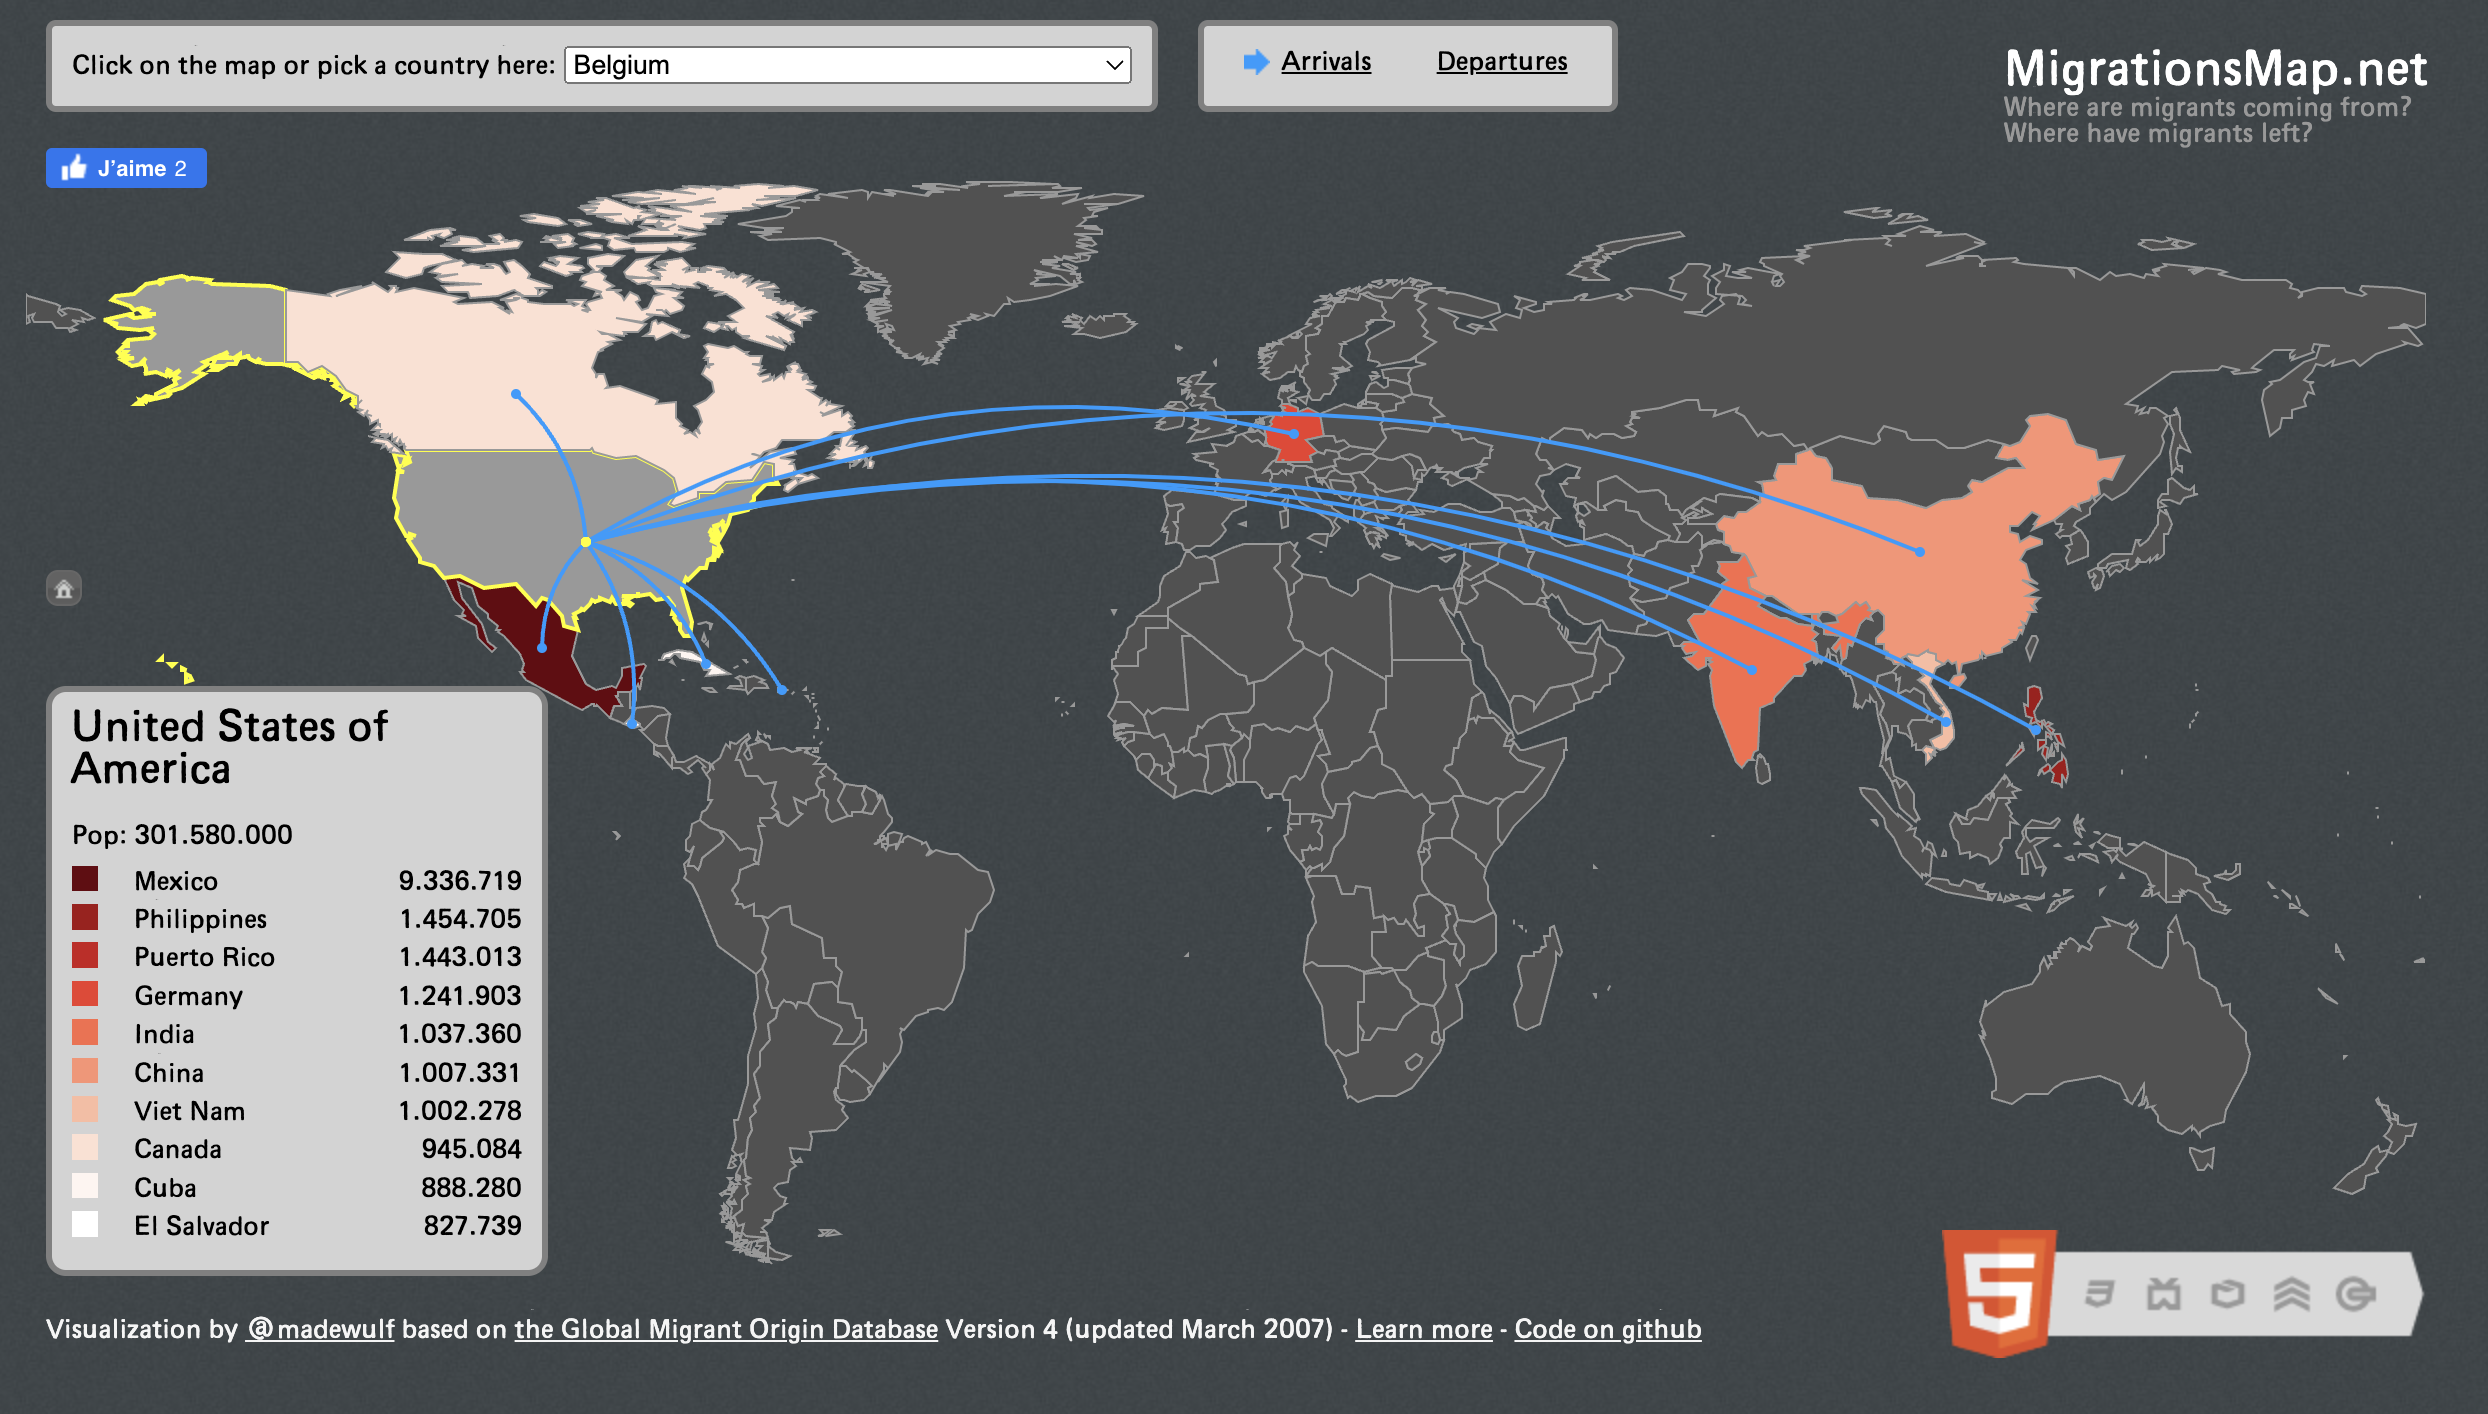
A visualization of the the Global Migrant Origin Database (previously located at migrationsmap . net , now squatted).
I made that map in a few evenings in 2011, manipulating SVG with Raphael.js.
At the time, libraries for vector maps were not very good yet, so, I built something myself. The code is my most starred project and was reused all over the place (e.g. in an Australian newspaper).
This introduced me a bit to #GIS, a field in which I’m more and more working these days and that I love. It happens that there a tons of stuff that is not mapped yet, like villages in DR #Congo, for example.
It’s a field where there is still room for tons of software improvements. Some features that you would think would be done by now, are actually still challenging, like getting tons of interactive shapes on a map in a browser.
Fun fact: the oldest software project that I remember was drawing a map of Belgium using . Logo.
I’m basically continuing that effort today.